
Stats 3.0.24
Stats menu bar system monitor for CPU, RAM, and sensors
Screenshots
Click to enlarge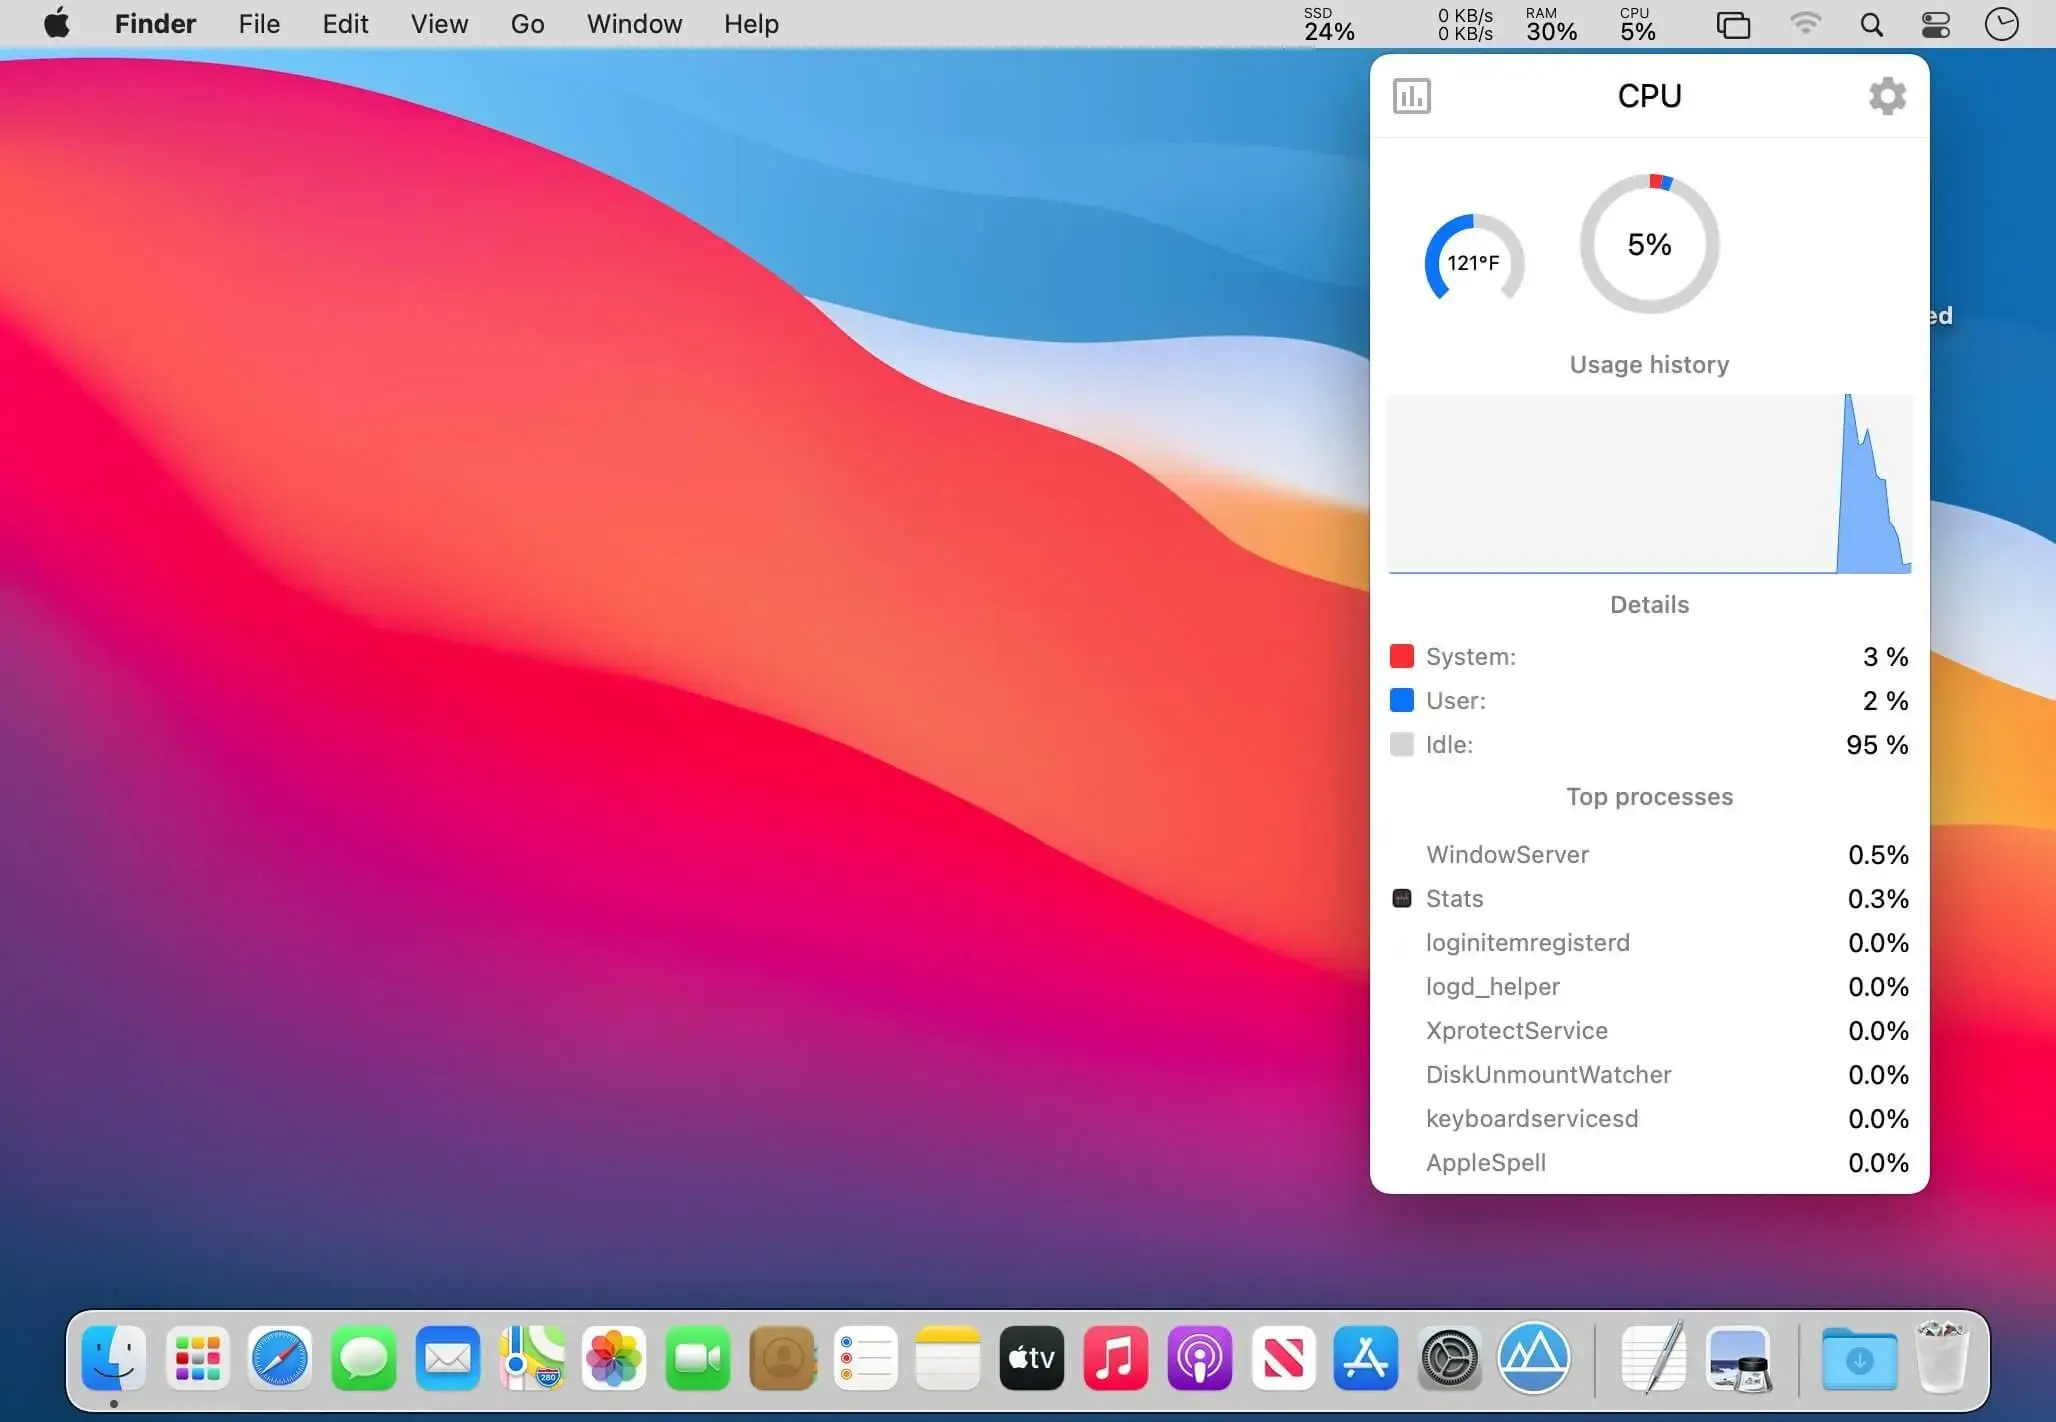
macOS gives you no easy way to check how hot your Mac's components run or how much power they draw. Stats puts those readings in the menu bar. It's free and open source.
- Pick exactly which sensors to watch, so you only see the data you care about.
- CPU, RAM, disk and network usage show up too, each as its own icon you can drag into place.
- Clicking any reading opens more detail.
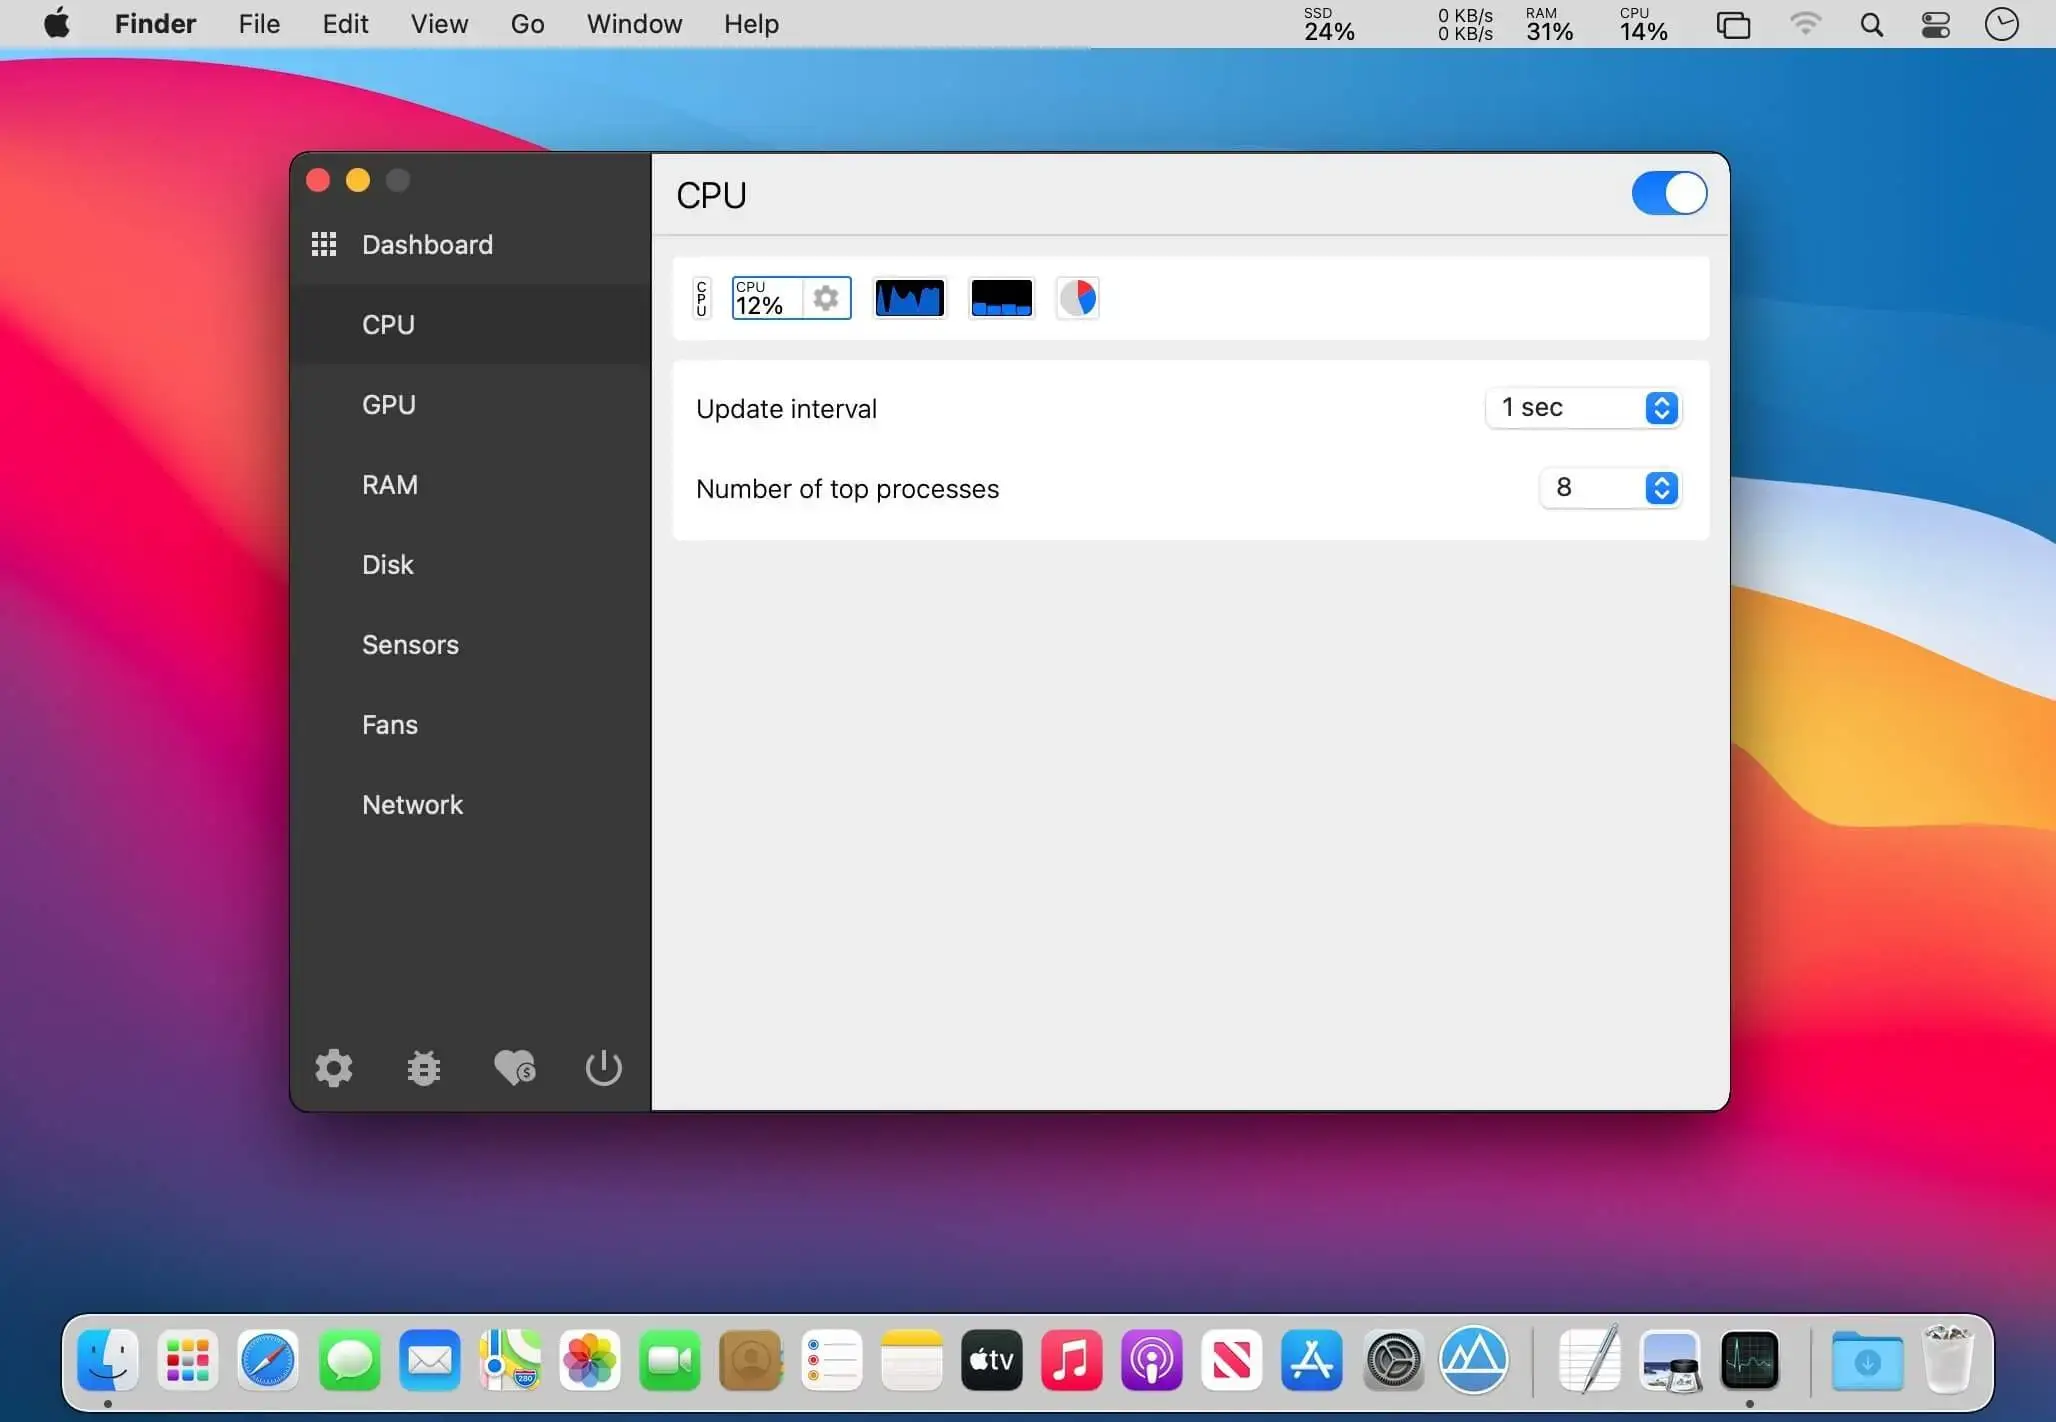
- There are a few indicator styles to choose from. Labels can be shown or hidden, which helps when an icon is hard to read at a glance.
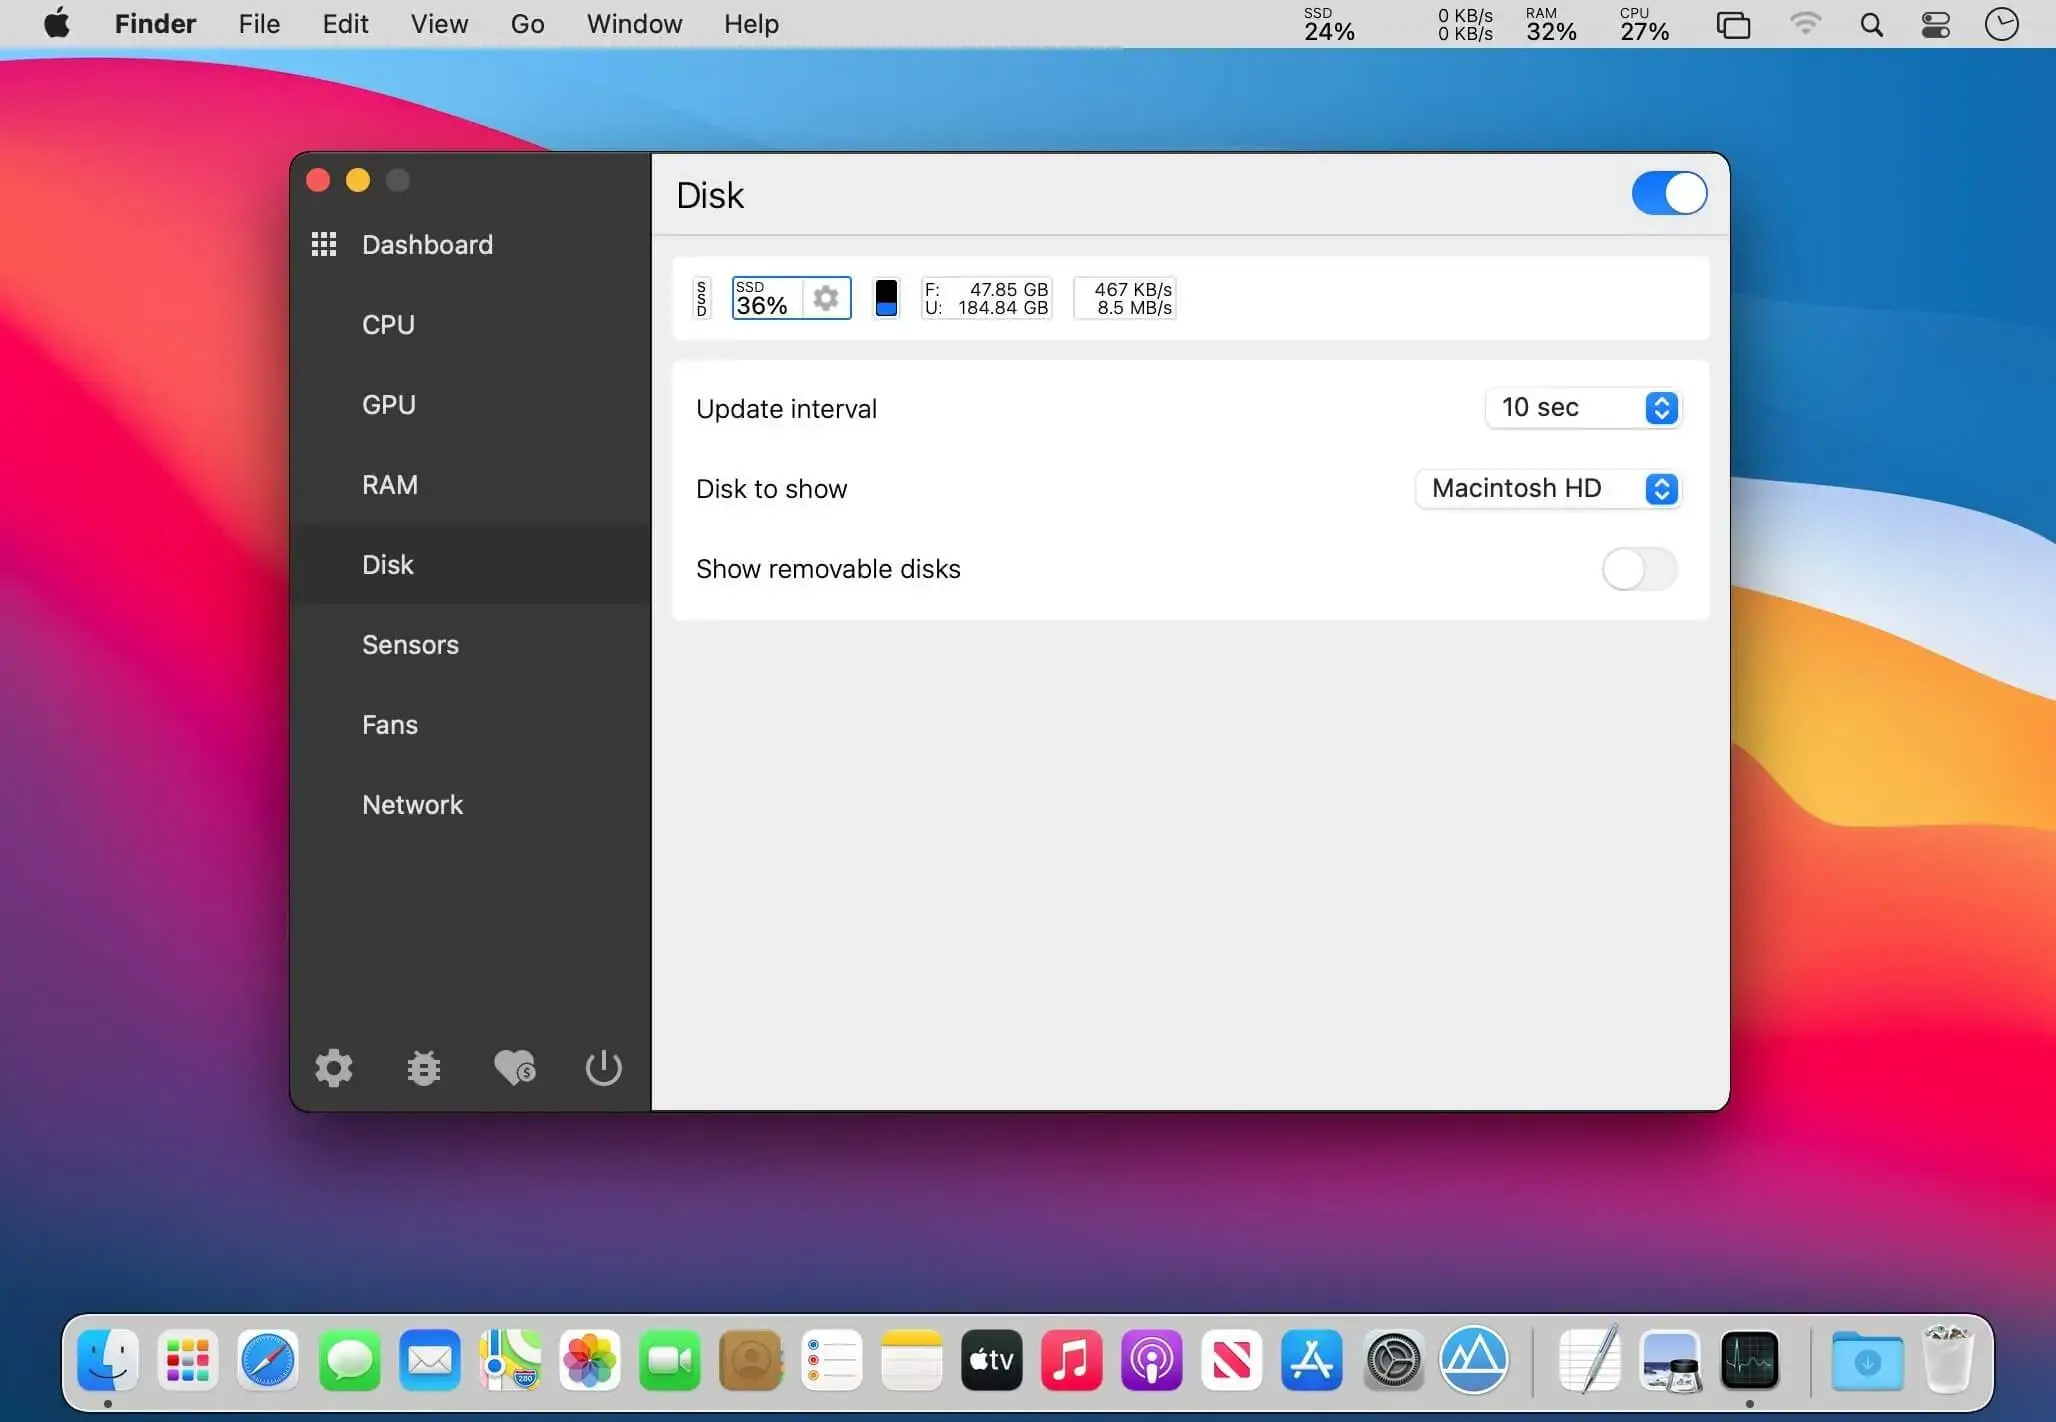
- You set the update interval, so readings refresh as often as you want.
- Battery level sits right next to everything else.
- Stats is actively developed, and more features are expected.
Version 3.0.24
Bug fixes
- fix: moved popup from NSWindow to NSPanel to prevent window flickering when switching between popups (#3619)
- fix: fixed the input stretching in StepperInput with a unit picker
- fix: fixed duplicated items in the menu bar when enabled combined modules with single icon and pause the app
New features
- feat: updated the Network public IP endpoint to ip.mac-stats.com
- feat: adjuster the Dock icon option when no windows are open (#3714)
- feat: added Sensors module support for System Stats and reduced Remote payload sizes
- feat: added an option to specify modules for System Stats monitoring
- feat: replaced the custom menu bar graph with the app icon
- feat: updated speeds formatter to always show two decimal places with fixed units (#3376)
- feat: added top processes to the GPU module (#3710)
- feat: added a preview overlay with an enable button for disabled modules
- feat: replaced the app icon with an Icon Composer icon
Localization
- lang: corrected Persian translations (#3720)
- lang: added translations for the unavailable preview message when a module is disabled
Comments
No comments yet. Be the first.
Information
Visitors in the group Guests cannot leave comments on this publication.