
System Dashboard Pro 5.1.0
Mac system dashboard for live CPU, memory, and network insights
Screenshots
Click to enlarge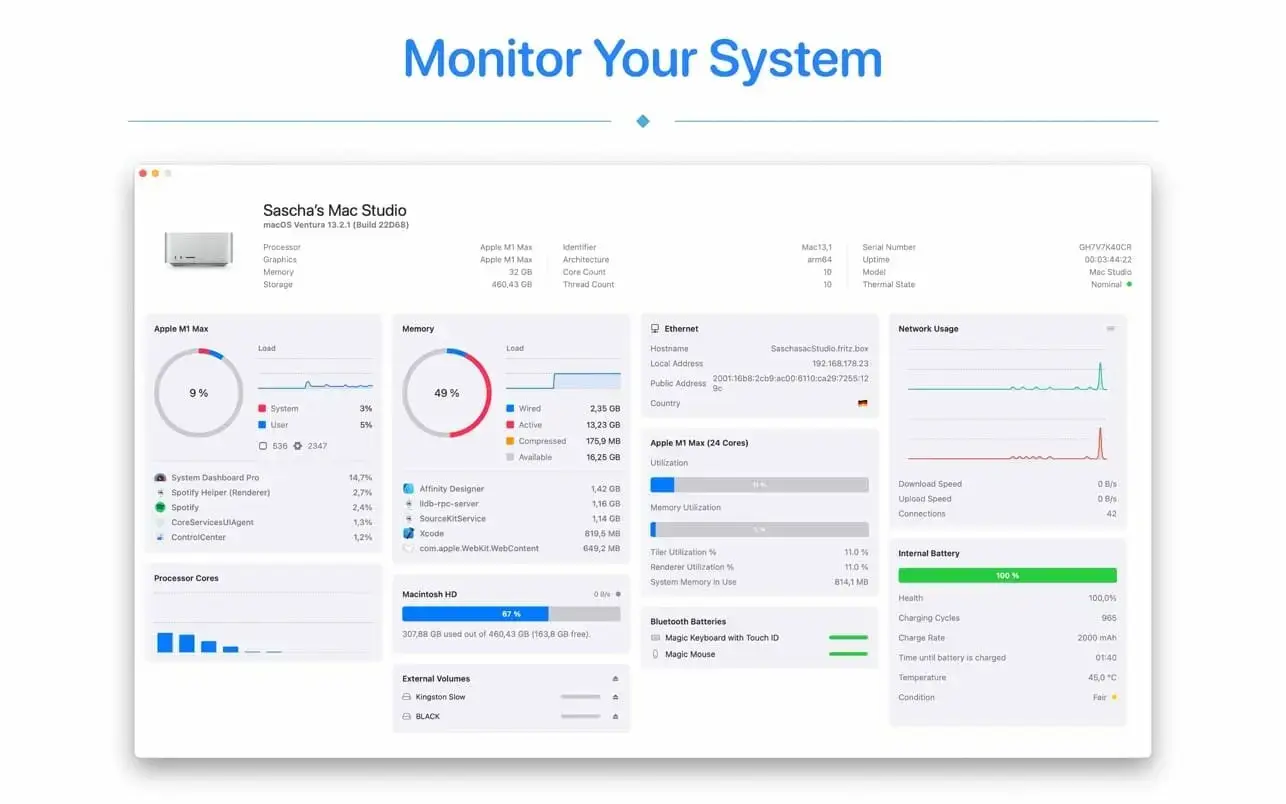
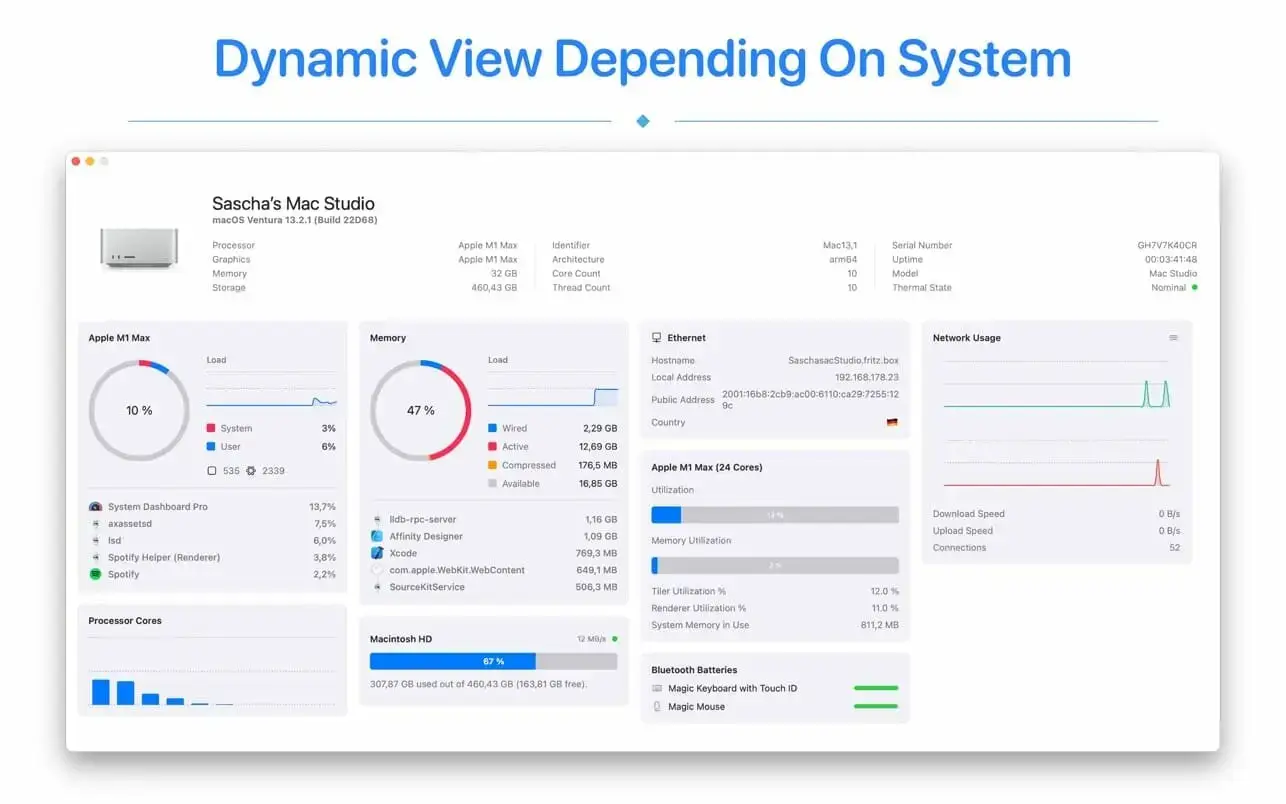
See what your Mac is doing right now with a live macOS dashboard for processor, graphics, memory, network, storage, battery, temperatures, and fans—all on one screen.
A dashboard that fits your workflow
Arrange tiles in any column or position, and System Dashboard Pro will keep your layout. Switch off panels you don’t need, and the dashboard adapts to your display. On narrow columns, it uses compact bars instead of gauges.
- Processor: View current load and a graph of activity over the last few seconds, split between system and user. Per-core bars cover every performance and efficiency core, and a process list shows what’s using the most processor time.
- Graphics card: Check GPU utilization and video memory, and see which apps are using the GPU.
- Memory: Track how much memory is in use and how usage changes, and find the processes using the most memory.
- Temperatures and fans: Read temperature sensors across your Mac and watch fan speeds in real time. This panel requires a small free plugin, with a direct link to it in the app.
- Network: See your adapter, hostname, local and external IP addresses, and the country associated with your external IP. For Wi-Fi, check transmit rate, signal strength, and noise.
- Network usage: Follow download and upload speeds over time, with current rates at a glance.
- Storage: Check used and available space on your startup disk, along with its current read and write speeds.
- Connected volumes: View the capacity and activity of external drives, SD cards, USB sticks, and mounted network shares over SMB, AFP, and NFS. Eject a single volume or all of them at once.
- Battery: On a MacBook, check charge level, condition, cycle count, and battery health.
- Power: On a Mac without a battery, view power draw over time, along with input voltage, current, and adapter loss.
- System overview: See your Mac’s model and identifier, architecture, serial number, core and thread count, uptime, and current thermal state.
- Display and refresh settings: Turn panels on or off, choose light or dark appearance, set how often values refresh, and read temperatures in Celsius or Fahrenheit.
Bring your Mac’s live system activity into focus with System Dashboard Pro.
Version 5.1.0
- Redesigned Other Apps window.
Comments
No comments yet. Be the first.
Information
Visitors in the group Guests cannot leave comments on this publication.